对一个 Django 站点做 ab 压力测试
2017.06.05
2242 Words
-Views
-Comments
今天想起来测测一个小 Django 站点的性能和压力,寻找一下看有没有内存泄漏,先介绍下服务器的信息,站点部署在 Google Cloud Platform,实例尺寸是微型(1 共享 vcpu, 0.6GB 内存),价格大致是($4.28/月 估算值),地区是 asia-east1-c,速度还是挺快,由于之前送的 300 刀还没用完,所以不用担心钱钱问题。
部署方式主要参照的这篇文章 《How To Set Up Django with Postgres, Nginx, and Gunicorn on CentOS 7》,大致内容如下:
- CentOS 7
- Python 3.6.1
- Nginx 1.10.2
- Gunicorn 19.7.1
- Virtualenv 15.1.0
- Django 1.11.1
测试命令:
ab -c 5 -n 1000 http://www.cocoaz.com/结果:
This is ApacheBench, Version 2.3 <$Revision: 1757674 $>Copyright 1996 Adam Twiss, Zeus Technology Ltd, http://www.zeustech.net/Licensed to The Apache Software Foundation, http://www.apache.org/
Benchmarking www.cocoaz.com (be patient)Completed 100 requestsCompleted 200 requestsCompleted 300 requestsCompleted 400 requestsCompleted 500 requestsCompleted 600 requestsCompleted 700 requestsCompleted 800 requestsCompleted 900 requestsCompleted 1000 requestsFinished 1000 requests

Server Software:        nginx/1.10.2Server Hostname:        www.cocoaz.comServer Port:            80
Document Path:          /Document Length:        15823 bytes
Concurrency Level:      5Time taken for tests:   277.324 secondsComplete requests:      1000Failed requests:        0Total transferred:      16049000 bytesHTML transferred:       15823000 bytesRequests per second:    3.61 [#/sec] (mean)Time per request:       1386.619 [ms] (mean)Time per request:       277.324 [ms] (mean, across all concurrent requests)Transfer rate:          56.51 [Kbytes/sec] received
Connection Times (ms)              min  mean[+/-sd] median   maxConnect:       21  208 425.4     24    3162Processing:   100 1170 1442.9    801   20850Waiting:       76  702 661.3    488    4786Total:        124 1378 1561.5   1034   20883
Percentage of the requests served within a certain time (ms)  50%   1034  66%   1501  75%   1807  80%   2000  90%   3014  95%   3816  98%   5270  99%   6200 100%  20883 (longest request)
StackDriver 监控状态:
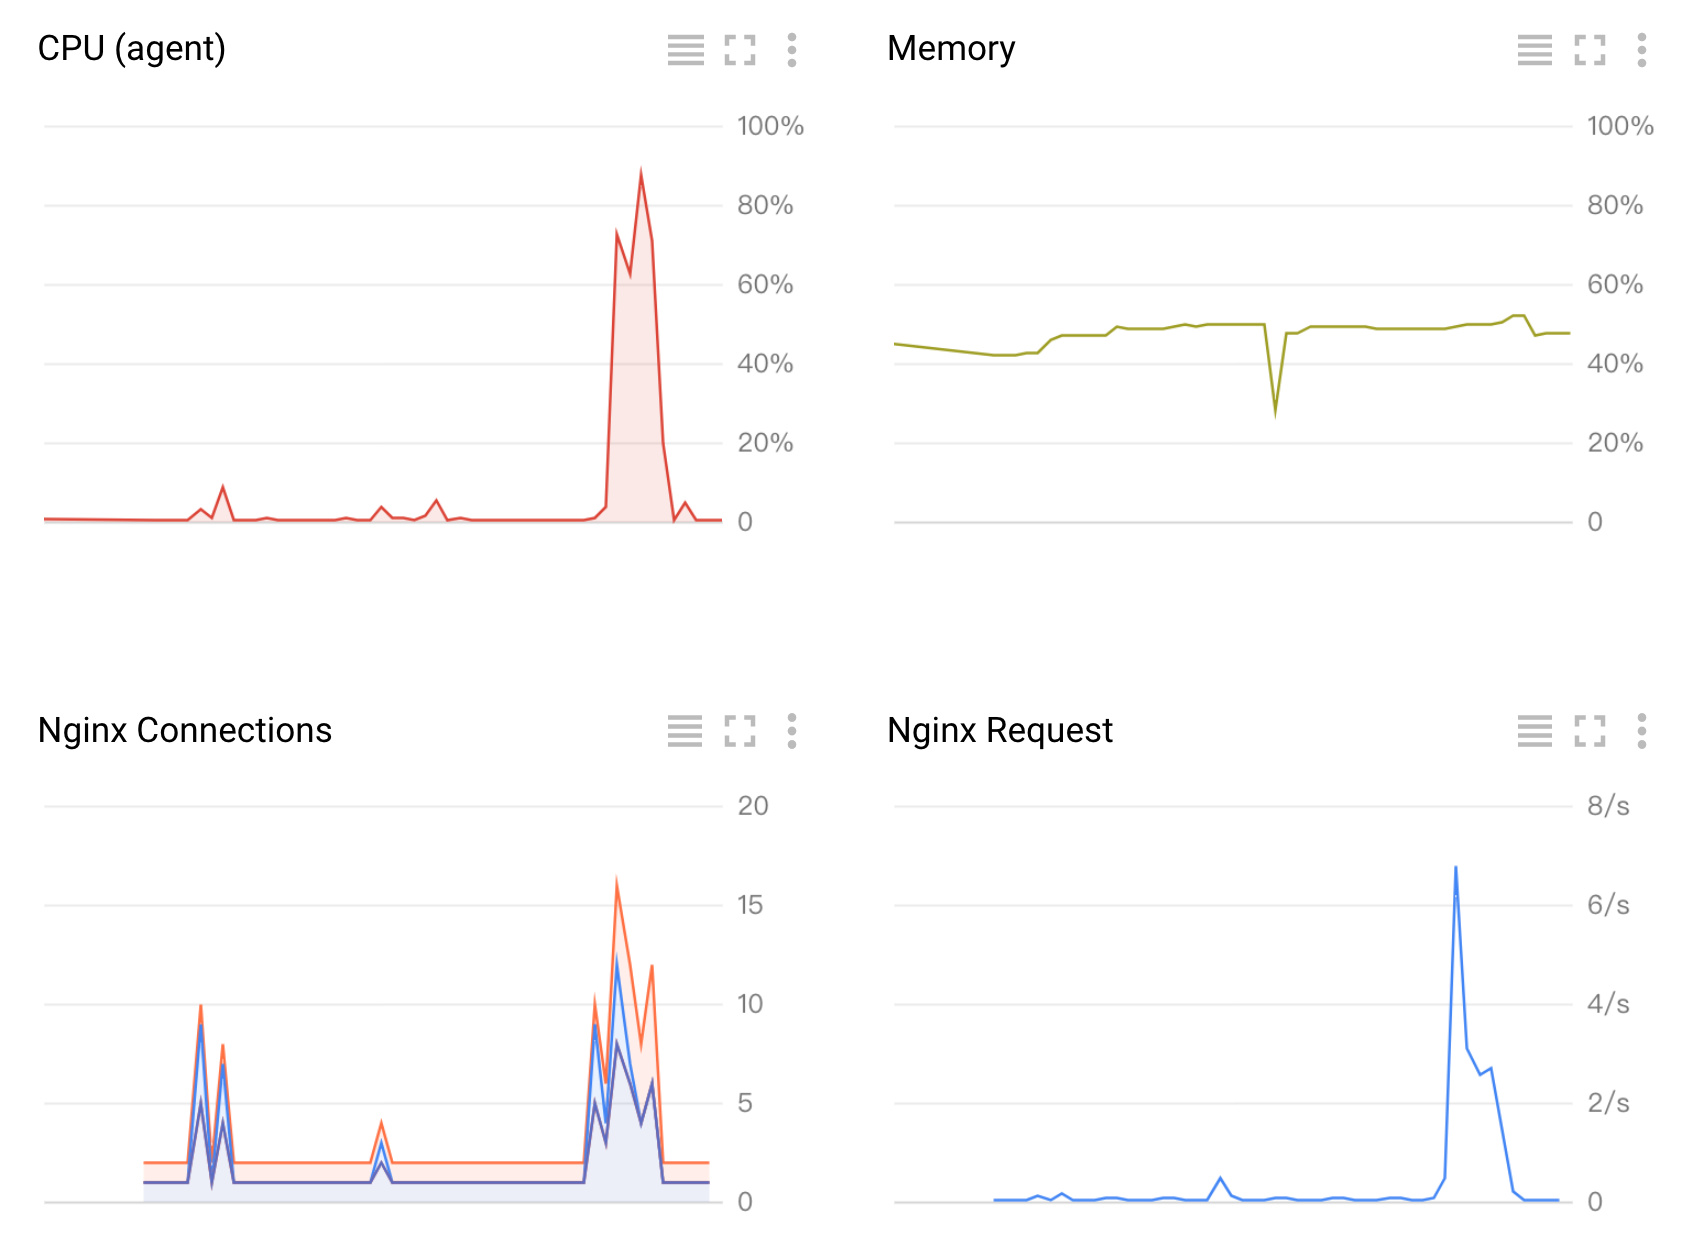
通过监控能看到 CPU 使用率最高飙到了 90%,内存一直稳定在 50% 左右倒是没怎么变化,所有请求都成功返回。